Παρασκευή 25 Οκτωβρίου 2013
Πέμπτη 24 Οκτωβρίου 2013
Nanex ~ 23-Oct-2013 ~ Options: Bad Taste, More Filling
Nanex ~ 23-Oct-2013 ~ Options: Bad Taste, More Filling
The cost of processing stock option quotes is skyrocketing, yet option trading is shrinking. Costs are exploding primarily due to unrelenting growth of quote spam, most of which is from High Frequency Traders (HFT) bringing quote spoofing algo games over from equity trading.High quote rates create significant burdens for everyone relying on accurate market prices. It increases networking, processing and storage costs. It makes it difficult for regulators to monitor the market or investigate unusual activities. For example, the SEC didn't even bother to look at option data during the flash crash, because there was too much of it: they didn't have the ability to process the enormous amount of option data created on that day. Yet today, option data is 3 to 4 times larger than it was on the day of the flash crash! Does that mean the regulator can't monitor the options market, so anything goes? It sure looks that way to us.
Shrinking trading volumes are rare on Wall Street, except maybe, during a Great Depression. Perhaps the increase in data costs has something to do with less trading?
Something is wrong here.
Below are 10 charts that show the unrestrained explosion of option quotes and the stagnation in option trading. Statistics are generated from OPRA (Options Price Reporting Authority) data (trillions and trillions of records) that Nanex has processed and archived since 2003.
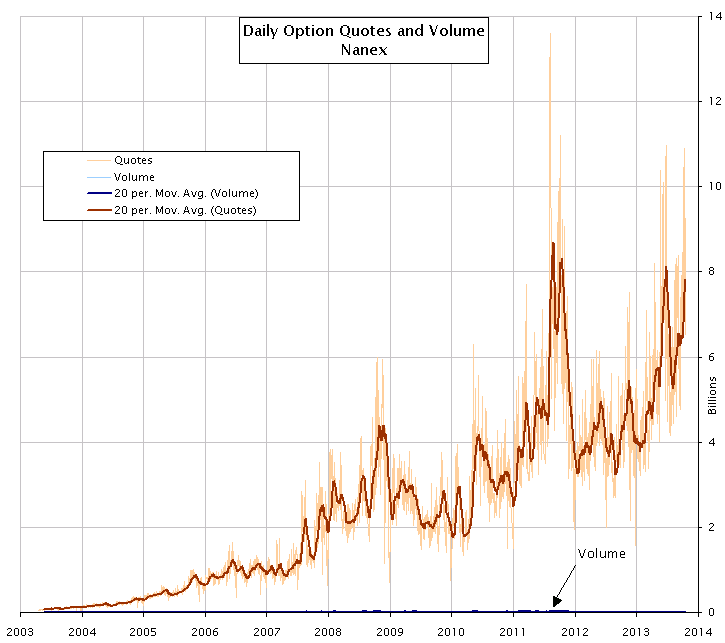
1. Option Quotes are exploding, but where is the Volume?
- Brown line: total number of stock and index option quotes for each trading day. Scale is in Billions!
- Blue line: total option volume traded each trading day (it's practically invisible at this scale).
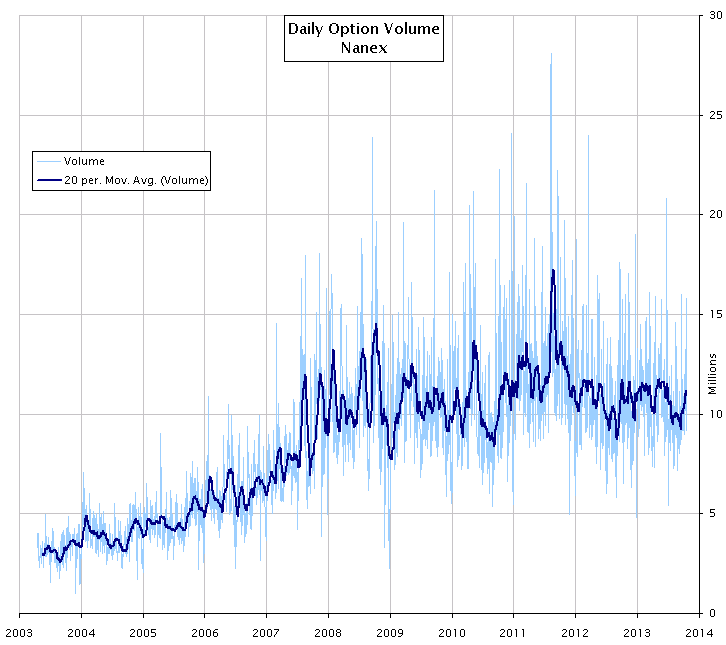
2. No growth in option volume (actual trading) since 2008.
Same chart as above, but without quotes and scaled for option volume. Here we clearly see that growth in option trading has stalled since 2008.Shrinking trading volumes are rare on Wall Street, except for during Great Depressions. What could be the problem?
3. How many quotes does it take to get 1 option trade? More than 10,000.
Dividing number of option quotes by number of option trades. 10,000 quotes for every trade!.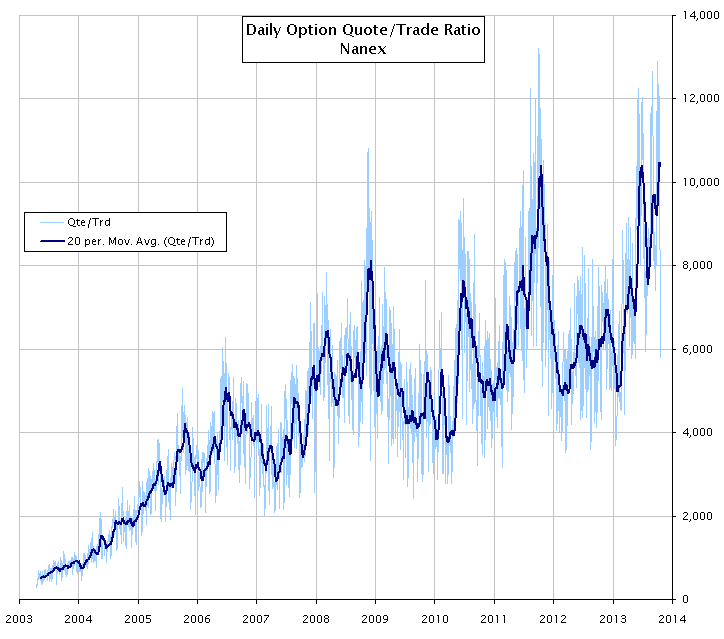
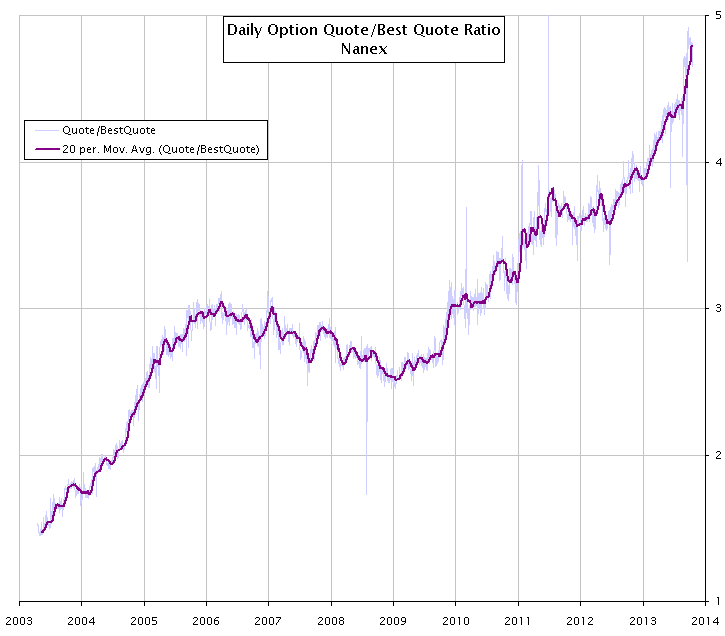
4. Fewer quotes are worthy (better price) to set the NBBO.
Chart shows the ratio of the total number of option quotes divided by the number of quotes that were at the NBBO (National Best Bid Offer).Not all option quotes change the NBBO . About 1 out of 5 option quotes are good enough to set the NBBO. Part of this is from the addition of new exchanges.
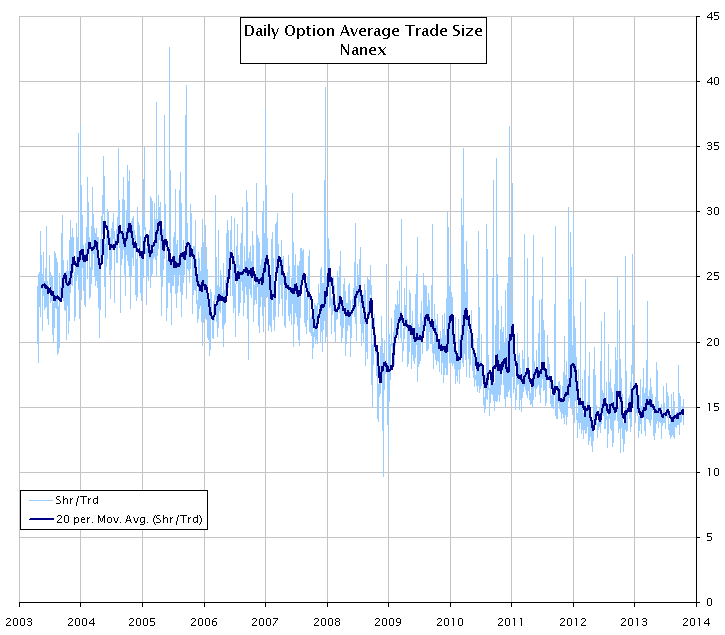
5. Average option trade size is shrinking. A clear sign of High Frequency Trading.
Chart plots option trade volume divided by the number of option trades for each trading day.The average size of an option trade is declining. This is a symptom of High Frequency Trading (HFT).
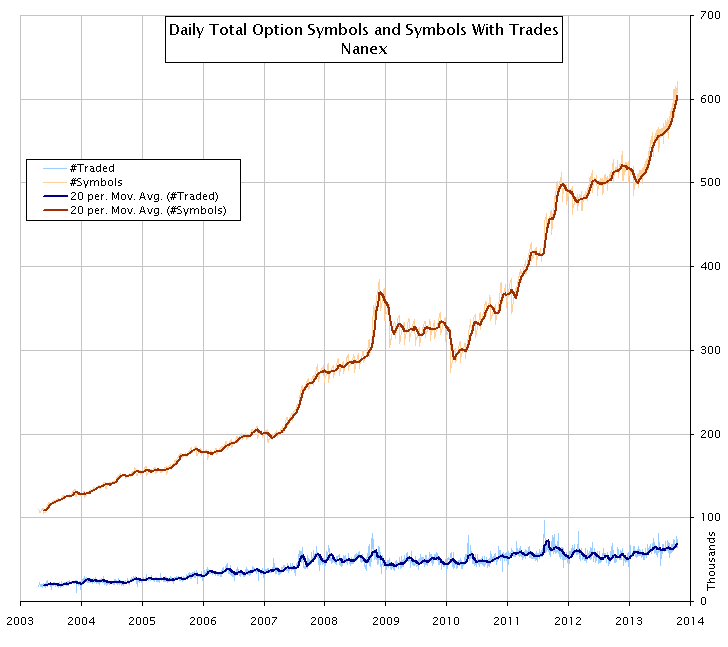
6. The total number of quoted option symbols is exploding (but few are traded).
Not all option contracts trade, but they all quote, prolifically.An option symbol represents one option contract. An option contract has an expiration date, a strike, is a put or call, and an underlying (which stock or index it is based on).
- Brown line: total number of individual option contracts (unique underlying, strike, expiration, put/call) for each trading day.
- Blue line: total number of individual option contracts that traded each day.
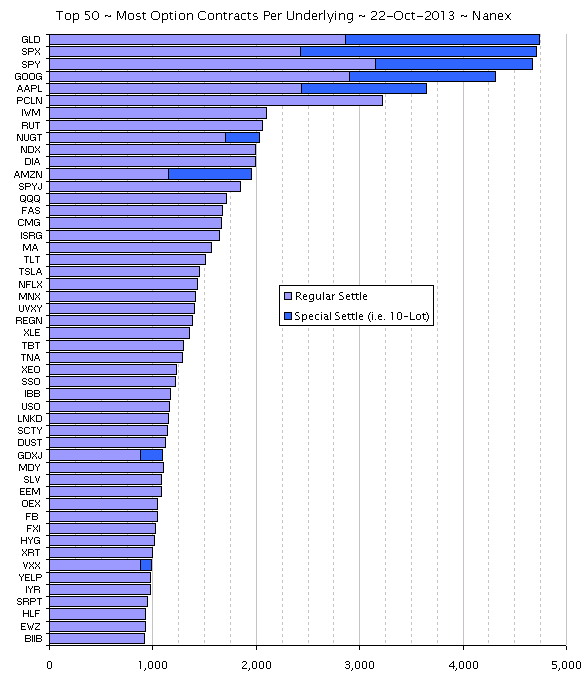
7. The 50 stocks or indexes with the most option contracts - most have more than 1,000. Each.
Chart shows the 50 stocks (or indexes) with the most option contracts.Several stocks have more than 4,000 individual option contracts: each with a unique expiration date and strike. A few stocks (SPY, GLD, AAPL, GOOG, AMZN) also have options that settle with 10 shares instead of the standard 100. When a stock price changes, most of it's option prices will change too. With 12 option exchanges, that can be a lot of quote changes. When stock prices change many times per second, there can be 500,000 or more option price changes in a second: for just that one stock!
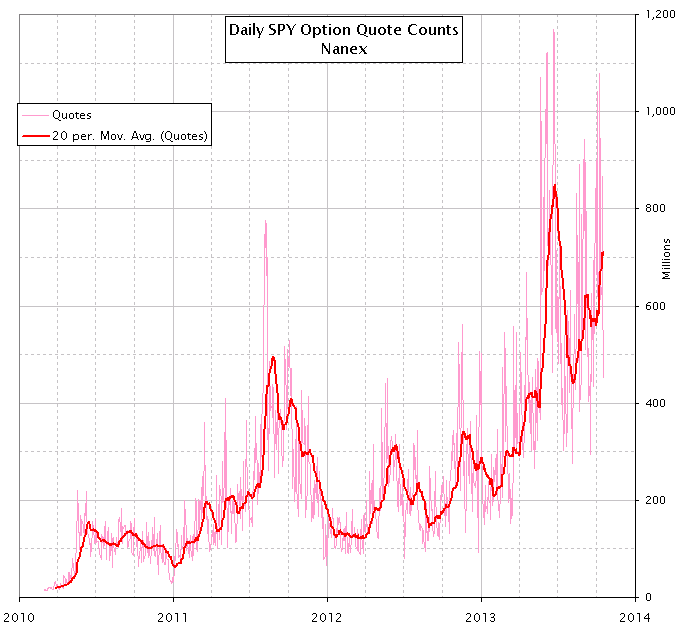
8. Almost 1 billion SPY option quotes. In a day.
Chart shows the total number of option quotes for the underlying symbol SPY for each trading day.The number of option quotes in SPY alone, exceeded 1 billion in a single day. This happened for several days in 2013 and by the looks of chart below, we will likely see many more of these days. This growth is alarming.
(See also 1.1 Billion Option Quotes which has more charts and data).
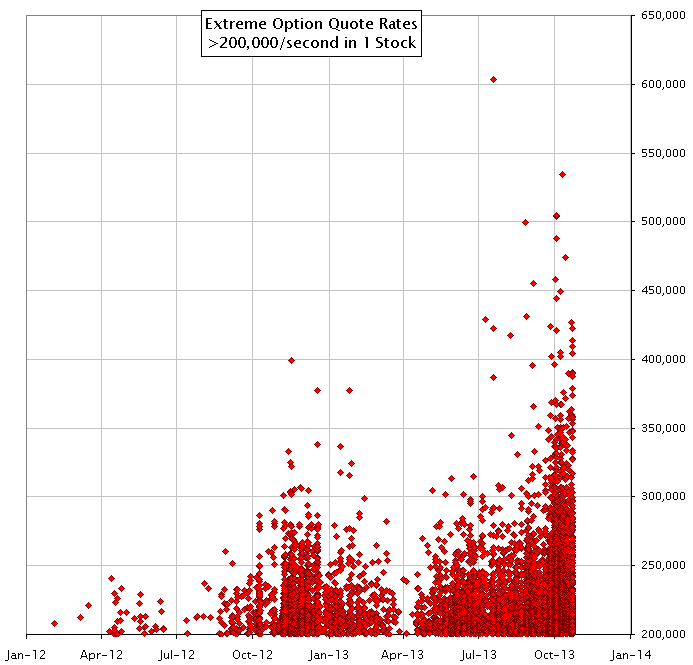
9. Alarming trend: the sudden appearance and growth in extreme option quoting (200,000 or more option quotes in 1 second in 1 Stock).
Chart shows every instance when the number of option quotes for a single stock exceeded 200,000 in 1 second.That's right, a single stock with over 200,000 option quotes in 1 second. 99.9% of these quotes (orders) are canceled and never executed. Many times there can be thousands of orders placed and canceled in 1 second in a single option symbol (remember, there are 600,000 option symbols). Someone needs to buy the regulators and exchanges a calculator. If one high frequency trader's (HFT) computer "accidentally" places and cancels 1000 orders a second in every option symbol it would generate 600 million option quotes in 1 second and decimate every computer downstream that is processing options (that, or result in significant delays). If 10 HFT did this, it would create 6 billion option quotes in 1 second. Now that is price discovery.
Each dot shows the date and count of option quotes in 1 second, in 1 stock. The highest recorded instance was 600,000 on July 19, 2013. The first recorded instance was December 30, 2011. The number of instances of extremely high option quote rates in a single stock is exploding.
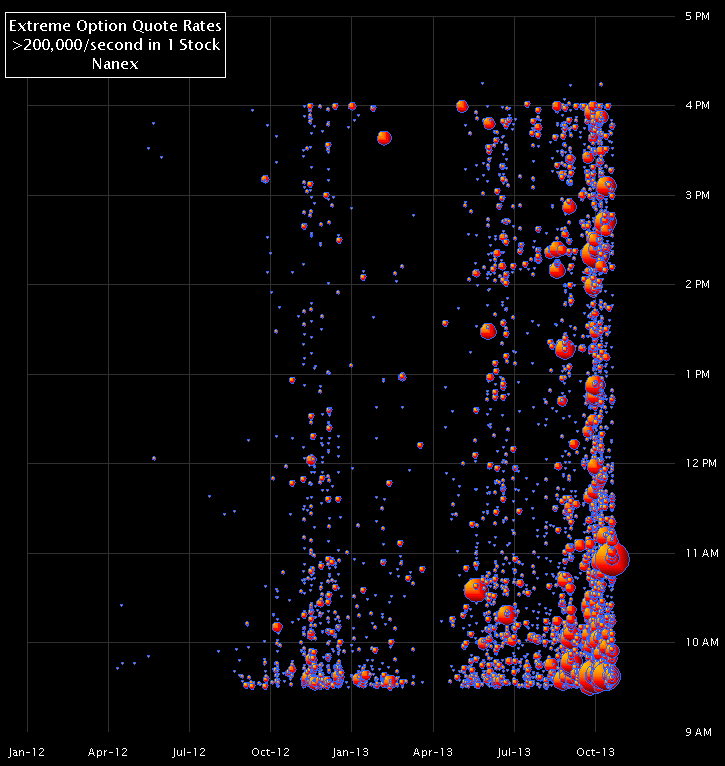
10. Extreme Option Quoting: by Time of Day.
Chart shows the same data from Chart 9 above, but plotted by time of day, and sized by the number of options quotes in one symbol in 1 second..Each circle shows the date and time of day when a single stock had 200,000 or more option quote updates in 1 second. Larger circles equate to more quotes in that one second.
Δευτέρα 21 Οκτωβρίου 2013


Παρασκευή 11 Οκτωβρίου 2013

Τρίτη 1 Οκτωβρίου 2013

http://www.zerohedge.com/news/2013-10-01/wtf-chart-day-vix-shutdown-edition
http://www.zerohedge.com/news/2013-10-01/wtf-chart-day-vix-shutdown-edition
Rather than discuss this insanity in the end-of-day note, we though the following charts deserve their own moment in the limelight of algos-gone-wild "momentum ignition" infamy (as we explained here and here).
As Bart Chilton said - the CFTC is offline - so anyone can pummel the VIX; after all it's not a stock!!

The fun began as usual at 330ET as VIX and EURJPY was employed but clearly with S&P futures stuck at VWAP they needed some help... so with 10 minutes to go in the day, size entered and short-term protection was smashed lower, Dec VIX was sold heavily, and EURJPY (FX carry) bid aggressively... the result - a 9 point almost instantaneous ramp through the entire order stack to close the cash markets at their highs on the day the US government shutdown.

and in case you were wondering how the machines managed to get the Russell 2000 to new highs... here is the quote volume behavior for the Vanguard Russell 2000 Value fund VTWV...

These are your "markets"...
Rather than discuss this insanity in the end-of-day note, we though the following charts deserve their own moment in the limelight of algos-gone-wild "momentum ignition" infamy (as we explained here and here).
As Bart Chilton said - the CFTC is offline - so anyone can pummel the VIX; after all it's not a stock!!

The fun began as usual at 330ET as VIX and EURJPY was employed but clearly with S&P futures stuck at VWAP they needed some help... so with 10 minutes to go in the day, size entered and short-term protection was smashed lower, Dec VIX was sold heavily, and EURJPY (FX carry) bid aggressively... the result - a 9 point almost instantaneous ramp through the entire order stack to close the cash markets at their highs on the day the US government shutdown.

and in case you were wondering how the machines managed to get the Russell 2000 to new highs... here is the quote volume behavior for the Vanguard Russell 2000 Value fund VTWV...
These are your "markets"...
Εγγραφή σε:
Αναρτήσεις (Atom)